

Listen to this article
Starting with Firebolt 4.28, queries with ORDER BY ... LIMIT 10 or smaller automatically skip reading columns until the qualifying rows are identified. On wide tables, this reduces data scanned by 50x and execution time by 30x. No configuration required.
Why this matters
Top-K queries power the workflows where latency is most visible: an analyst debugging a production incident needs the 10 slowest API calls now, not in 16 seconds. A customer-facing dashboard showing "top trending items" refreshes on every page load. An on-call engineer querying for recent errors can't context-switch while waiting for results.
These queries hit wide tables - event logs with debug traces, clickstream data with full URLs and referrers, session tables with request payloads. Traditional execution punishes this pattern: reading every column for every row, then discarding 99.99% of the data.
The business impact is straightforward: queries that previously blocked interactive workflows now return instantly. Dashboards that felt sluggish become responsive. Debugging sessions that required patience become fluid. And because this is automatic, teams get the improvement without filing tickets, tuning queries, or scheduling optimization work.
The mechanism
When you run:
SELECT * FROM hits ORDER BY EventTime DESC LIMIT 10Traditional execution reads all 105 columns for all 100 million rows, sorts them, then discards everything except 10 rows. That's 87GB of I/O for 10 rows of output.
Late materialization splits this into two phases:
Phase 1: Identify qualifying rows. Firebolt reads only the EventTime column (8 bytes per row, ~800MB total) plus internal row identifiers ($tablet_id and $tablet_row_number). It sorts and identifies which 10 rows have the highest values.
Phase 2: Fetch remaining columns. Using the row identifiers from Phase 1, Firebolt performs a targeted read of just those 10 rows from the remaining 104 columns. This leverages the same granule-level pruning used elsewhere in the engine - the row IDs specify exactly which tablets and granules contain the needed data.
The query plan shows this as two StoredTable scans joined on the row identifiers:
[0] [Projection] hits.watchid ...
\_[1] [Sort] OrderBy: [hits.eventtime Descending] Limit: [10]
  \_[2] [Join] Mode: Inner [(hits.$tablet_id, hits.$tablet_row_number) = ...]
    \_[4] [StoredTable] Name: "hits"        <-- Phase 2: all columns, pruned to 10 rows
    \_[5] [Sort] Limit: [10]
      \_[6] [StoredTable] Name: "hits"      <-- Phase 1: EventTime + row IDs only
Result: 16 seconds → 0.5 seconds. 87GB scanned → 1.5GB scanned.
About those row identifiers
$tablet_id and $tablet_row_number are internal, stable identifiers that locate a row within Firebolt's storage. They're not physical positions - they survive concurrent writes and compaction. The Phase 2 scan uses these to perform what the literature calls "sideways information passing" or "semi-join reduction": the join pushes the qualifying row IDs down into the storage layer, which then prunes at the granule level (8,192 rows by default) to read only the tablets containing those 10 rows.
The overhead of the two-phase approach is the join and an additional sort (since the join may reorder results). For wide tables with small limits, this overhead is negligible compared to the I/O savings.
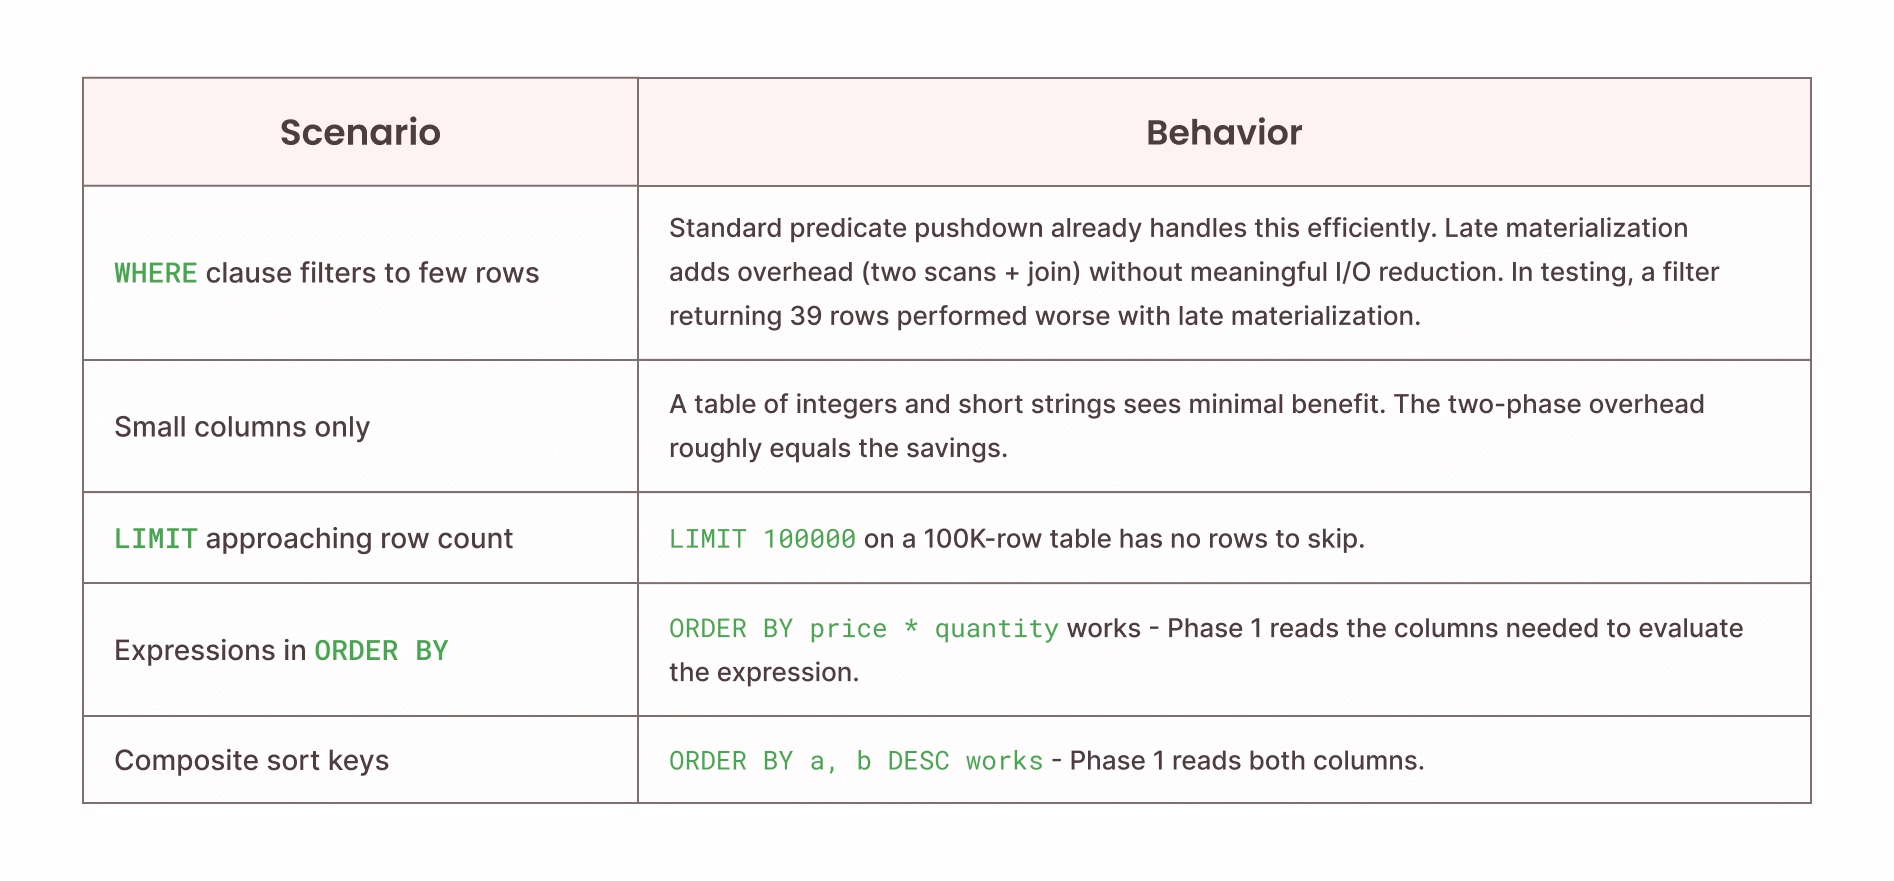
When it works and when it doesn't
Late materialization improves performance when two conditions hold:
1. Large columns exist that aren't needed for sorting. The bigger the non-sort columns (TEXT fields, JSON blobs, debug traces), the more I/O you skip. If all your columns are 4-byte integers, the savings are minimal.
2. The LIMIT is much smaller than the rows processed. If you're selecting 10 rows from 100 million, 99.99999% of column data is skipped. If your WHERE clause already filters to 50 rows before the ORDER BY, late materialization adds overhead without benefit.
Specific failure modes:
Why the default threshold is 10: The cost model balances I/O savings against join overhead. At LIMIT 10, the probability of significant savings on wide tables is high and the overhead is bounded. Firebolt applies late materialization conservatively - you can increase the threshold if your workload benefits:
-- Per query
SELECT * FROM hits ORDER BY EventTime DESC LIMIT 100
WITH late_materialization_max_rows = 100;

-- Per session
SET late_materialization_max_rows = 100;
Benchmark details
Dataset: ClickBench hits table - 100 million rows, 105 columns. Web analytics workload with integers, timestamps, and variable-length strings (URLs, titles, referrers).
Sort column: EventTime (TIMESTAMP, 8 bytes per value)
Source: All benchmarks from the Firebolt engineering blog on late materialization. Engine configuration not disclosed but consistent across comparisons.
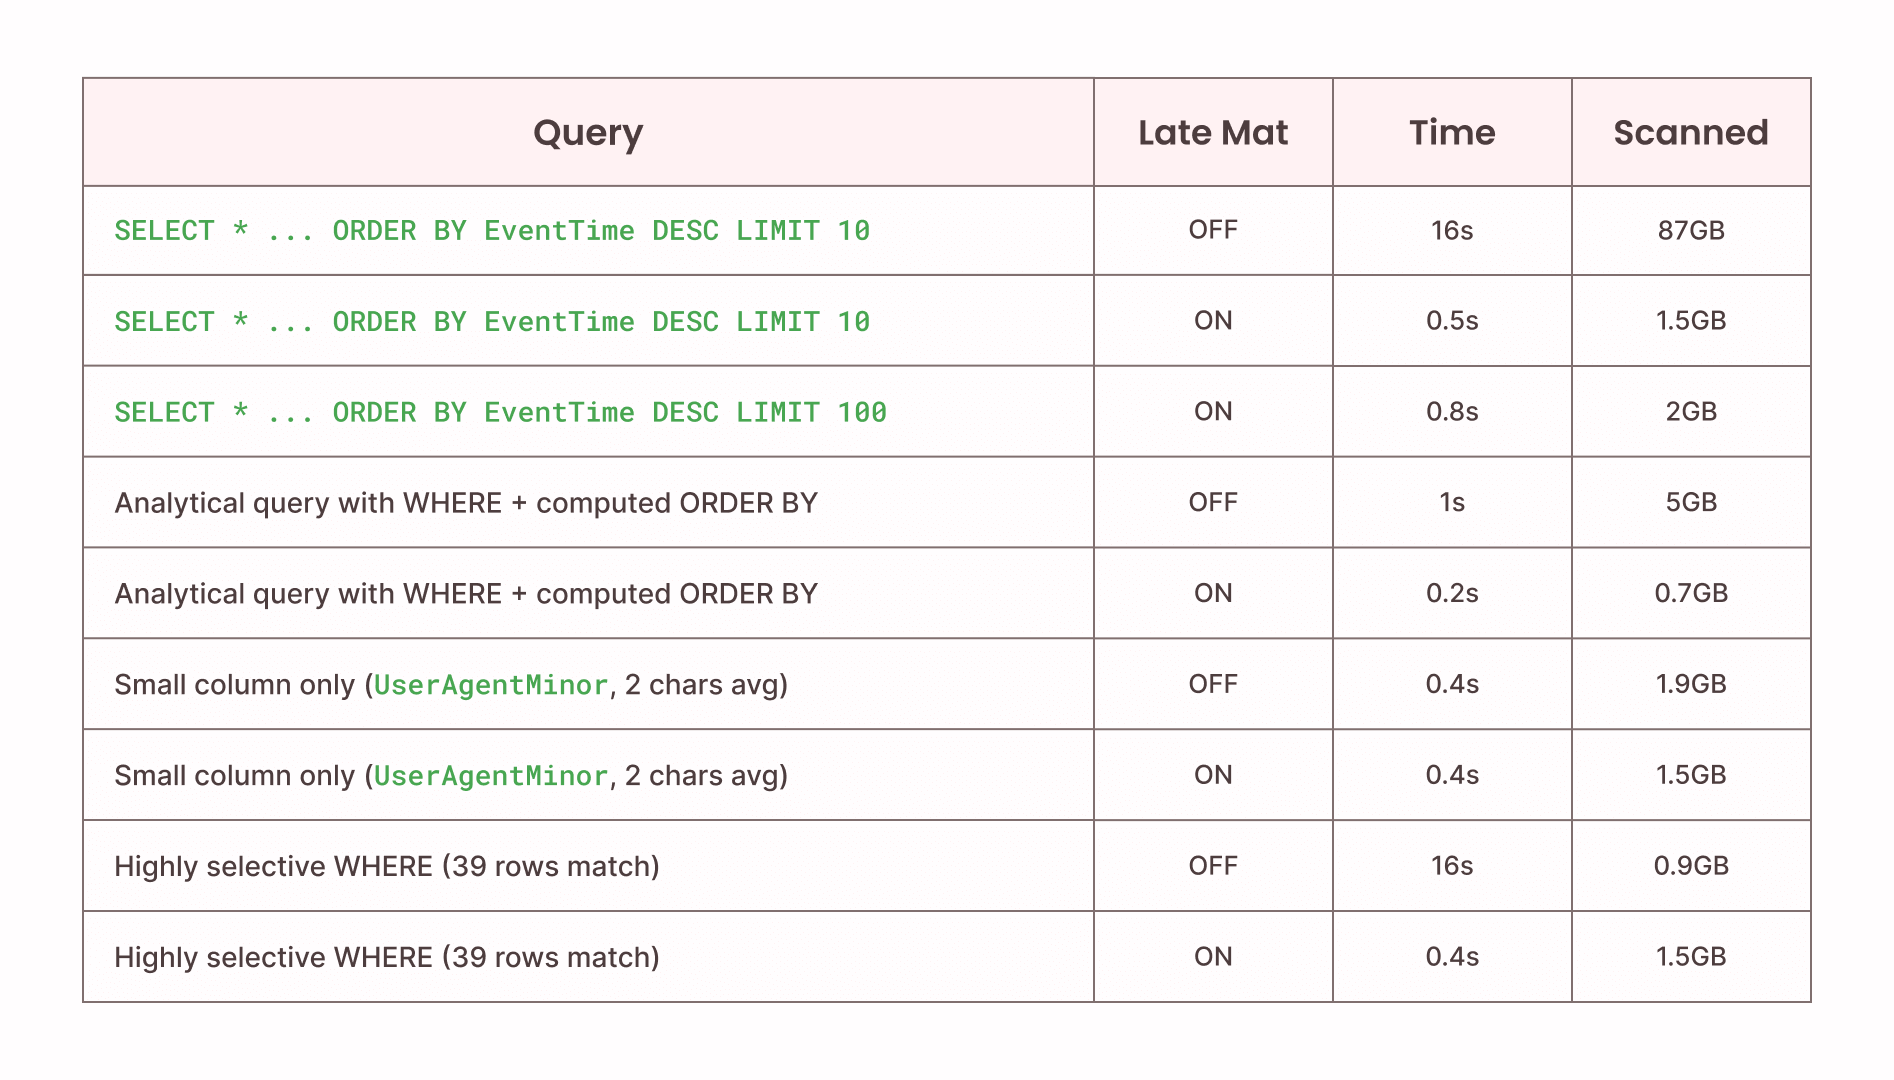
The "Small column only . . . " rows show the failure modes: small columns show no timing improvement; highly selective filters scan more data with late materialization because the optimization's two-phase approach reads the sort column for all rows before discovering the filter already eliminated most of them.
Interaction with other optimizations
Late materialization composes with Firebolt's existing pruning:
- Tablet pruning: Min-max sketches eliminate tablets before either phase begins. A WHERE EventDate = '2025-01-15' prunes tablets first, then late materialization applies to remaining data.
- Result caching: Cached results bypass execution entirely; late materialization only affects cache misses.
It does not currently interact with aggregating indexes (which precompute results) or vector search indexes (which have their own top-K execution path).
Verify it's working
Check if your queries are using late materialization:
-- Look for the two-scan join pattern
EXPLAIN SELECT * FROM your_table ORDER BY your_column DESC LIMIT 10;

-- Compare scanned bytes with optimization disabled
SELECT * FROM your_table ORDER BY your_column DESC LIMIT 10
WITH late_materialization_max_rows = 0;
Monitor query history for impact:
SELECT
    query_text,
    duration_usec / 1000000.0 AS seconds,
    scanned_bytes / (1024*1024*1024.0) AS gb_scanned
FROM information_schema.engine_query_history
WHERE query_text LIKE '%ORDER BY%LIMIT%'
    AND status = 'ENDED_SUCCESSFULLY'
ORDER BY start_time DESC
LIMIT 20;
What this means for your team
Late materialization reflects a broader principle: performance improvements that require manual intervention don't scale. Every optimization that needs a ticket, a query rewrite, or a tuning session competes for engineering time against feature work.
Firebolt's approach is to push these optimizations into the engine itself. Late materialization joins tablet pruning, granule pruning, and result caching as automatic behaviors that keep queries fast as data grows. Your team focuses on building products; the engine handles the performance work.
For existing Firebolt users on 4.28+, this is already active. Check your query history - your top-K queries on wide tables are likely running faster than they were last month.
Learn more
Demo repository: Reproduce these benchmarks and test on your own data: github.com/johnkennedy-cmyk/firebolt-late-materialization-demo
Engineering deep dive: Implementation details, query plan analysis, pruning mechanics: Pruning even more data with late materialization
Documentation: System settings reference: Late materialization docs
