At Firebolt continuous improvement is a core principle: it doesn't matter whether we roll out a new feature, make a tiny improvement or address a bug - we aim for an excellent service for our customers. Starting with Firebolt version 4.0 all releases of our database core go through an online upgrade process. In this post we shed light on the internals and explain our decision making.
What bar do we set to ourselves when offering an online upgrade to our customers? It is surfaced on three major pillars:
- Zero-downtime – the service is not interrupted during the upgrade.
- Seamless functioning – the switchover moment requires no actions from customers: no restarts, no client reconnects.
- Unnoticeable – without performance impact on running queries no matter what the current load is.
## Engine Upgrade
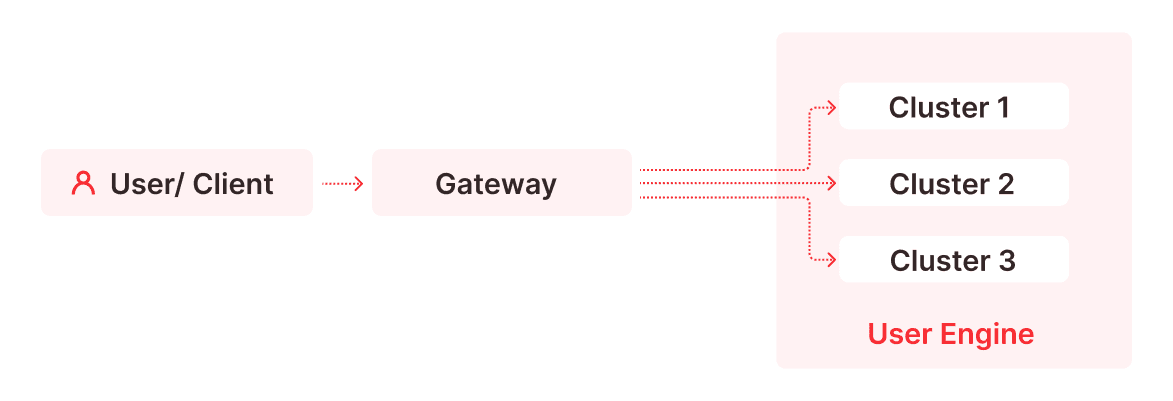
A given Firebolt engine can contain one or more clusters and each cluster may consist of multiple engine nodes. Cluster configuration is homogeneous, meaning that clusters have the same number of nodes of the same type. From the client perspective an engine is exposed by a gateway service that hides from a user all actual running engine nodes. These nodes may belong to different clusters, but all have an exact same version. When we talk about the online upgrade we mean the change of version of engine nodes. All other Firebolt components: the gateway, control plane, UI can be upgraded by a standard Kubernetes gradual rollout process. But what makes engine nodes so special?
A graceful rollout process usually means launching a new instance of a service, rerouting new connections to the new instance, waiting for old connections to drain and then to shut the old instance down. However the process relies on one important fact - both old and new instances do not have any state and if they would have some then that shared state would be a separate service. Database processes of course have state - SSD storage, but besides this they also have local caches and having those caches hot is crucial for a high performance.
Firebolt engines have two main types of caches: data cache to avoid unnecessary S3 reads and subresults cache to optimize query performance. Both caches are local to an engine node. When we do an online upgrade we need to ensure that both caches are in a warm state before making a switch. Thus engine nodes with the new version need to run in parallel to the old one and also process queries. To protect user data from modification these new nodes can only execute read-only DQLs. We call such engine nodes Shadow.
Overall the upgrade process consists of the following steps:
- Shadow creation – for each engine cluster we create a copy with identical instance type and number of nodes, but a new version.
- Traffic mirroring – the gateway is configured to mirror all DQL queries to both Main (old version) and Shadow (new version) clusters.
- Warm-up & verification – we keep running both clusters in parallel warming up Shadow's cache.
- Switch-over – the gateway is switched to use Shadow cluster; all new queries are processed by the new version.
- Drain – upgrade process waits for completion of all queries running in the old version.
- Cleanup – the old cluster is removed.
The warm-up and verification step allows us to compare two versions of the product side by side on the same set of queries. The version comparison also gives an opportunity to try new versions out and do this without actual upgrade. This allows us to catch failures and performance regressions earlier in the release cycle and ensure that the release is in good shape before starting the rollout.
## Warm-up & Verification
So we have two almost identical clusters executing the same DQL queries and would like to ensure that at the end the new one can show the same performance as the old one. Besides a pure performance goal it also gives a good opportunity to detect binary regressions such as runtime errors. In particular:
- database process crashes
- queries that succeed on the old version but fail on the new one e.g. caused by changed validation rules
- and the opposite - queries that fail on the old version but succeed on the new one e.g. caused by a parser regression
The comparison logic is implemented in Firebolt's control plane, with the data retrieved from the local engine history. In particular it may give us query type, query duration, exception code if the query failed and other execution insights such as number of reads from S3. Once the gateway receives a user query it forwards the query to Main and if the query is a read-only DQL then to Shadow too. The gateway also tags a query with a timestamp watermark to ensure that the control plane can select the same set of queries disregarding the time when they are actually processed by a cluster.
How do we compare the performance of queries executed by Main and Shadow clusters? First logical idea would be to make a pairwise comparison, but in practice it doesn't produce stable results because:
- Main cluster also runs DML queries and they influence performance of DQL queries, thus giving Shadow cluster an advantage.
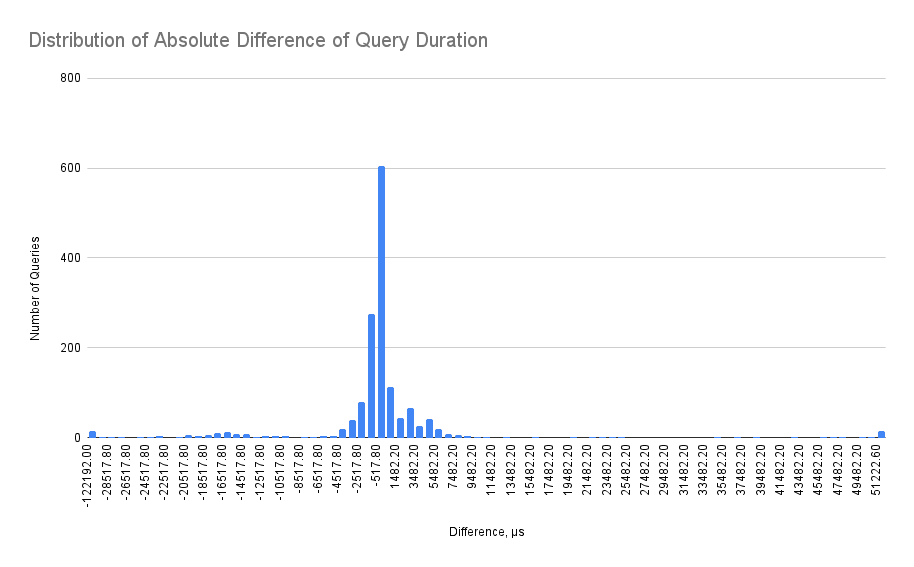
- Comparison of absolute duration values is significantly influenced by slowest queries contributing to the tail of the distribution.
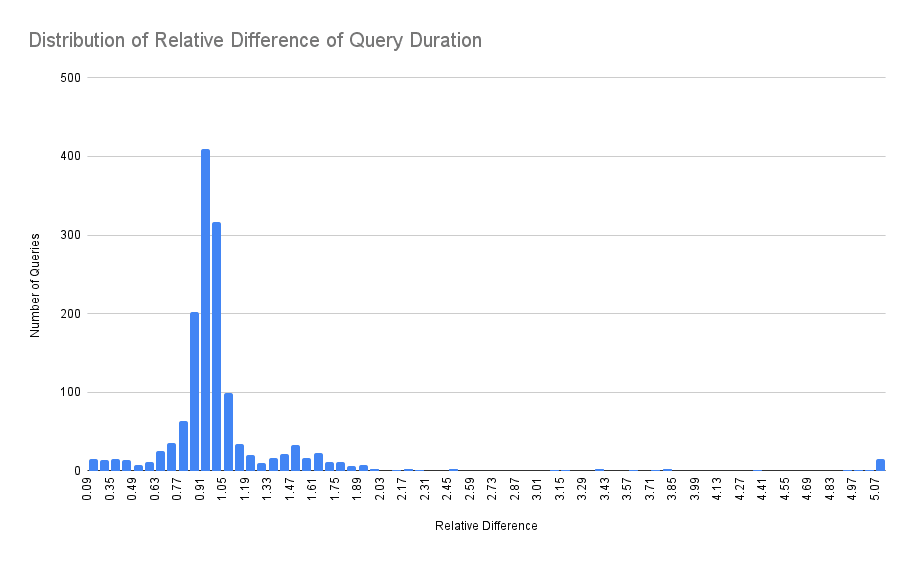
- Comparison of relative values is impacted by randomness of the fastest queries.
The solution instead is to compare percentiles of distribution of query durations. So instead of making a pair-wise comparison we need to collect a set of queries and then calculate the percentiles. But how many of the queries do we need? A common answer is for moderately skewed data and a 95% confidence interval; sample sizes of a few hundred (e.g., 200-300) are often considered a reasonable starting point. However, for more heavily skewed data or when estimating extreme percentiles, you might need samples in the range of 500 to 1000 or even more. So it's time to look at the actual distribution:
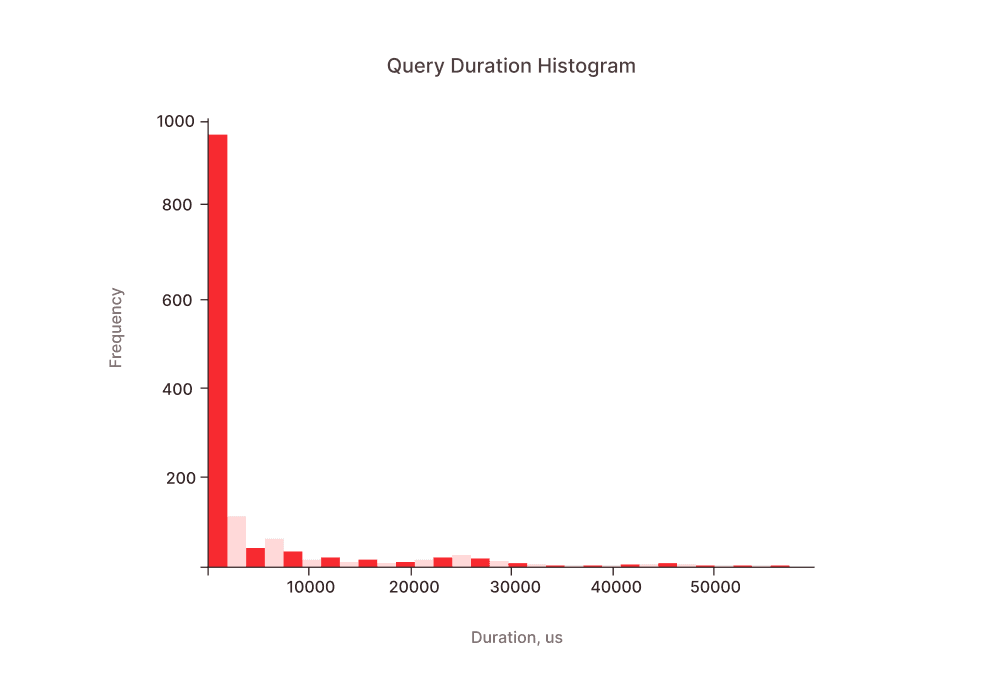
If all queries were of the same type we could expect the distribution to be a sort of Gamma distribution with a longer tail. But we have different types of queries and each of the types follow some Gamma distribution, so the final distribution is a multimodal with multiple "hills" overlapping each other (one can see around 3 hills in the chart above).
Now we need to estimate the number of queries to put in a single sample set to calculate their percentiles. Basically we not only need the percentile value itself but also a confidence interval of the value. The narrower an interval the stricter an estimated value is. Ideally if we plan to accept 10% variation between Shadow and Main percentiles we need to require the confidence interval to be even lower. Going deeper into statistics, a confidence interval is also not defined strictly, but with e.g. 95% of certainty. Luckily all this can be calculated by using the bootstrap approach and then by iterating the sample size and checking when the confidence interval stabilizes.


While calculation of 50th percentile stabilizes at approximately 400 samples, the 95th only at 600. In practice these estimations are very dependent on the distribution and for some even a 1000 items is not enough.
From the implementation perspective the verification process is a loop, retrieving query performance metrics at each iteration. If the number of observations is enough for a confident analysis then we calculate the percentiles and compare the values from Shadow and Main. The process repeats until:
- Metrics successfully converge meaning there is no significant difference between Main and Shadow – a clear success!
- There are not enough observations to make any statistically significant decision, still the cache is warmed up, also a success!
Internally the verification process also looks into S3 reads operations and state of a subresults cache. If the engine is fully dedicated to analytics queries (DQLs only) then both caches warm up quite quickly. In the chart below X axis is local time and Y axis shows number of operations within a time window (defaults to 5 time intervals):


And finally this is how performance convergence looks as percentiles:

But what happens in case of a performance regression? If query durations on the upgraded version are worse than on the Main, then all percentiles shift upwards. Below is a chart corresponding to a performance regression detected in our end-to-end jobs. When such a condition is detected, the upgrade process is aborted and further root cause analysis performed.

In conclusion, Firebolt's online upgrade process prioritizes zero-downtime, seamless functioning, and minimal performance impact. By utilizing shadow clusters and traffic mirroring, the system ensures cache warm-up and runtime verification. This approach allows us to detect binary regressions and performance issues earlier delivering a robust and continuously improving service.