ON THIS PAGE
As a lunch-break experiment, we wrote a small raytracer to test Firebolt. In SQL, of course. Because they contain a huge number of expressions, those queries turned out to be a brutal stress test for our query planner. Over the past weeks, several improvements made some of those queries more than 10x faster and improved the query latency of one of our customers by 10-15%.
But first things first: how do we show raytraced images from SQL? One of our goals was that the raytracer runs directly in the terminal. A while loop in bash calls curl on our query endpoint and prints the result. For the colors, we used shell escape codes for truecolor terminals. In order to increase the resolution, we used the "upper half block" character (▀) with foreground and background color, which gives two square pixels per terminal cell. The initial query started simple, but then it quickly gained Phong lighting (one of the simplest lighting models in interactive computer graphics), SSAA for antialiasing (sending multiple rays per "pixel" and taking the average), and at some point shadows and reflections.
The queries are surprisingly simple: one join, and the rest is just a lot of expressions in nested common table expressions. The idea was to take those queries as they are and not to tweak them to get them as fast as possible. While there are several opportunities to rewrite the queries for performance, we deliberately didn't. Our goal was to improve the default experience for new queries written by humans or agents. So we spent time profiling the queries rather than optimizing them manually.
## Findings
It turns out, the bottleneck was mostly in the planner. This is also due to the runtime being parallel and the resolution not being very high on a terminal, so not much number crunching was needed. We started to investigate mostly based on Claude looking at the profiler, summarizing the findings and implementing the hints we gave on how to best solve the bottlenecks. In the initial phase, the idea was to improve the performance as much as possible, almost like a hackathon, without thinking too much about whether those changes make sense for other queries. After several hours, we were happy with the resulting performance and started taking apart the individual changes. We measured their effect, and investigated how well they fit the Firebolt architecture. We then spent the next two weeks properly implementing the ideas of that hackathon. Reaching the performance improvement rather quickly shows how fast one can move today with agent support. However, we also found that the agent took shortcuts and added improvements that do not fit the overall Firebolt architecture. In the following sections, we give examples of the most impactful changes.
### Metadata Performance Degradation
An initial version of the queries also tested the write path: one query updated a table containing the rendered frame, and another simply performed SELECT line FROM buffer ORDER BY y in a loop. Watching the rotating cube for a while, we noticed that the animation was getting more and more choppy. We reproduced this using a simpler query, as the figure below shows for UPDATE t SET v = v + 1 WHERE id = 1.
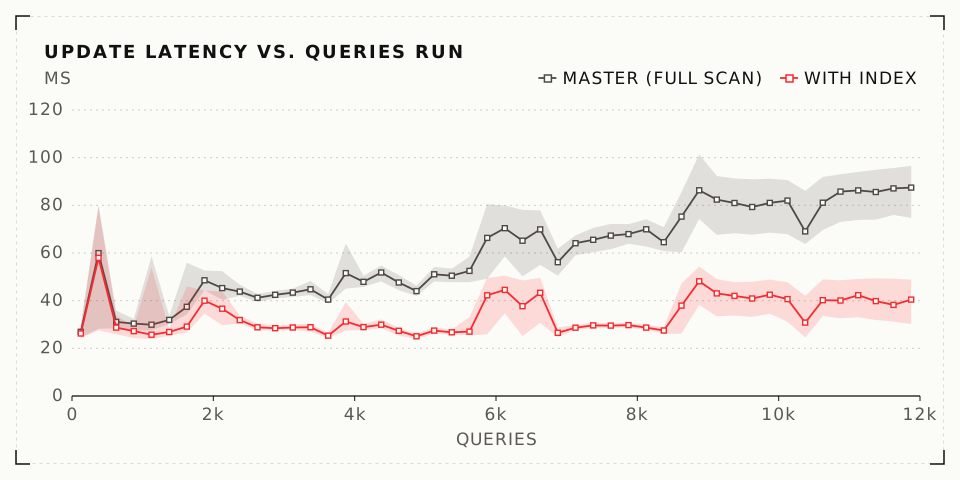
It turns out that this was caused by the metadata layer in our free offering, Firebolt Core. While we have a high-performance, multi-tenant metadata service for our managed offering, Firebolt Core uses a simple SQLite database. Each update query rewrote the entire frame buffer table, so the metadata entries of its old tablets became outdated. We kept those entries in the metadata database to be cleaned up later. However, every commit had to scan through all of them to find the live entries. The solution was to add an index in the metadata layer that speeds up access to live entries. This can be seen as more of a safeguard than a production fix, considering that our production workloads rarely rewrite an entire table 25 times per second, and it only affected Firebolt Core.
### gRPC Timers
During profiling, we noticed that the raytracing queries are idle for a significant portion of their time. The fix is a single line of code. In that code, we want to post work to be executed on a background executor immediately. Take a few seconds to think about why this implementation might be too slow.
- alarm_.lock()->Set(&executor.cq(), std::chrono::system_clock::now(), MakeTag(Op::kStartDone));+ alarm_.lock()->Set(&executor.cq(), gpr_inf_past(GPR_CLOCK_REALTIME), MakeTag(Op::kStartDone));It turns out that scheduling a task for std::chrono::system_clock::now() actually rounds the time up to the next millisecond, so the deadline lies in the future. This means gRPC treats it as a real timer, and the timer thread only wakes up about 2 ms later. We call it for every query stage, so each query pays this delay once per shuffle in the plan, plus one. In more complex joins with hash shuffles this is more pronounced, but even in simple distributed queries we have at least two stages due to gathering the results on one node.
This one-line change makes every query stage cheaper. For example, expensive stages became a problem when we introduced late materialization. Queries that use late materialization need more stages, so we had to be very careful to only perform late materialization when we are very sure that it is worth it. Now with the stages being cheaper, we can increase the default LIMIT at which late materialization kicks in.
With the change, we improved the median latency for a simple query (UPDATE t SET v = v + 1 WHERE id = 1, which has 4 stages plus 2 for internal bookkeeping) by about 20%, as shown in the plot below.
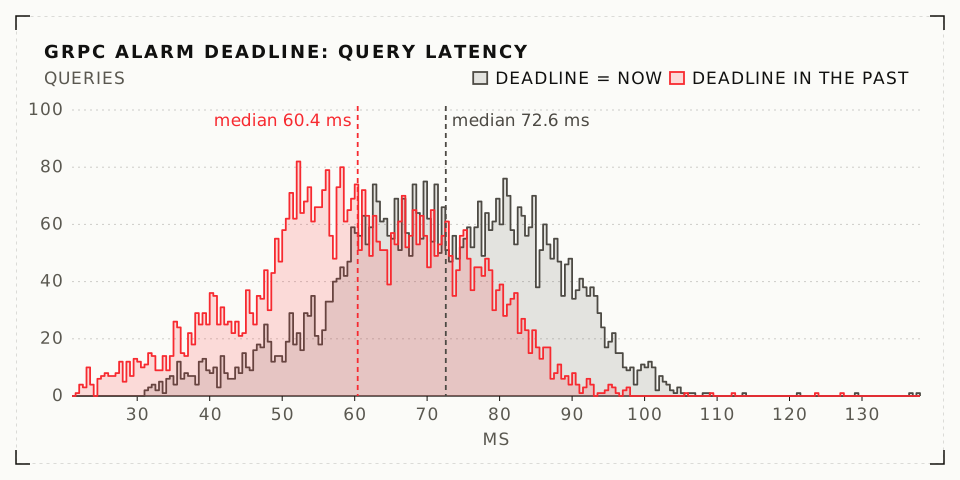
We rolled out just the single-line code change to our customers and immediately saw the effect. For example, one of our customers uses many simple queries scanning single tables with filters. When not cached, these queries complete in about 25 ms and have two stages. In practice, this single change alone reduced this customer's latency by about 10-15%.
### Data Type Calculation
Expressions in the Firebolt planner are represented based on the concept of input references. An input reference refers to the index of the column relative to the node it is stored in. This means that when changing the nullability of the input column during planning, we do not have to rewrite expressions. The input references come from Apache Calcite, which we took inspiration from when we rewrote our planner between 2022 and 2024.
However, input references make determining the data type of a (sub)expression more difficult. In order to determine the data type, we have to walk the entire subtree. To combat this, we use caching for data types during expression walks (for example during expression reduction). In hindsight, using input references has its costs, and we could simplify our code structure by using typed expressions. During the raytracing experiments, we extended these caches to additional places. These places previously ran a preorder walk and calculated the data type at each visited node, which made the running time quadratic in the expression depth.
### Repetition-Aware Expression Reduction
The Firebolt planner contains a powerful expression reduction framework. To make those reductions more streamlined, Firebolt merges multiple projections in the optimizer, and inlines their expressions into each other. We inline by reusing shared pointers to the repeated expressions, leading to expressions being a directed acyclic graph. However, the experiments on the raytracer showed that several places in the planner still inlined shared expressions by copying them. This turned expressions more and more into a tree shape, blowing up the repeated parts. We extended this sharing to the generic expression rewriters used throughout the planner, so they keep subexpressions shared if they were shared before.
Another improvement around repeated expressions is let factoring. Months ago, we saw good performance improvements in the optimizer for a customer query by adding a planner-internal let function:
[1] [Projection] f(y) + f(y) \_[2] [Projection] y: g(x)usually gets merged into
[1] [Projection] f(g(x)) + f(g(x))but with let factoring, which we already did for large expressions g(x) used more than once, we instead get
[1] [Projection] let((y) -> f(y) + f(y), g(x))We had originally implemented this as a planner-only representation and lowered it to inlined expressions for the runtime. For the raytracing queries, this broke down where the planner serializes the plan and sends it to all execution nodes: the serialized plan became too large to handle efficiently. In order to improve this, we added support for the let function in the runtime. This was rather simple because our runtime turns expressions into SSA (static single assignment) form before running them. Each let argument becomes one SSA assignment, and every use of the parameter y refers to it. Together with an additional improvement for faster hashing of subplans for subresult reuse, those improvements were the largest wins for the raytracing queries.
### Further Improvements
We also made smaller, mostly mechanical improvements that need no detailed explanation. In the planner, we moved cheaper condition checks up to reduce calculations. In the runtime, we first turned expressions into SSA form and then performed common subexpression elimination. Now we partially combine these steps to never write most of the duplicate subexpressions. Where referential stability is not needed, we now use boost::unordered_flat_map instead of std::unordered_map. This avoids one allocation per entry and gave up to 2.7x speedups for very large expressions. We also removed copies the C++ compiler cannot elide.
## Results
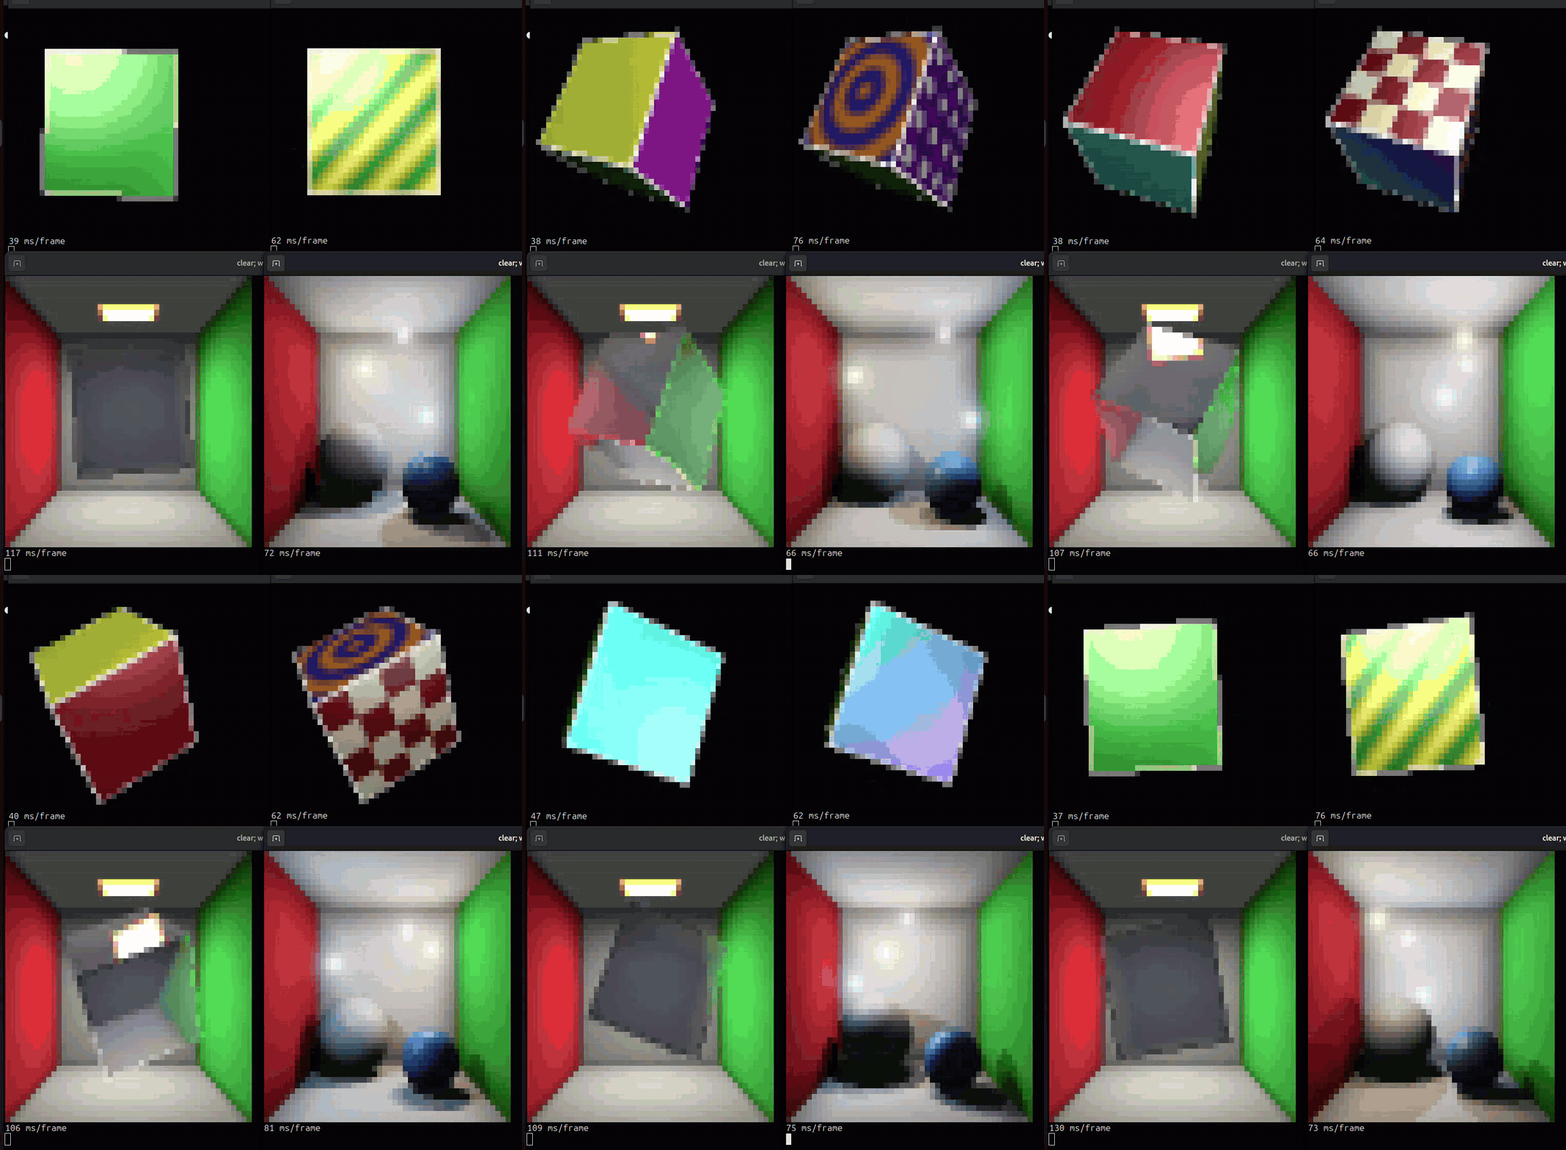
With the improvements merged, we can now conveniently render the raytracing queries on Firebolt. We run the experiments on a developer workstation with an Intel Core i9-14900K and render several frames each. Below, you can see the queries rendering on Firebolt now. The fastest scene renders at about 25 frames per second.
In the following, we give a comparison to other systems. Some systems, for example Postgres and DuckDB, treat a constant like 0.5 as an exact decimal number, which is much slower to compute with than floating point. To make the comparison fair, we forced all systems to compute in floating point by writing such constants as 0.5e0 or 0.5::float8.
For each engine, we keep the original versions of the queries, as well as one version where we added the materialized keyword to several common table expressions (CTEs). StarRocks has no way to materialize a CTE, so it runs the same query in both versions. Materialization makes the queries a lot faster for Postgres and the old Firebolt build. Note that the large performance improvements in Firebolt do not include materializing CTEs. They come from performance optimizations in how the planner handles expressions and for Firebolt, the logical plan stays the same after the performance improvements.
We think that it is important to test the non-materialized versions because that is the naive first query that users might type before they start optimizing their queries. Apart from the materialized keyword, we kept all engine settings at their defaults, with two exceptions. We raised a limit on expression size without which StarRocks rejects the queries, and we turned off JIT in Postgres because it makes these queries much slower. We compare against DuckDB 1.5.6, ClickHouse 26.9.25.15, PostgreSQL 16.15 and StarRocks 4.1.6.
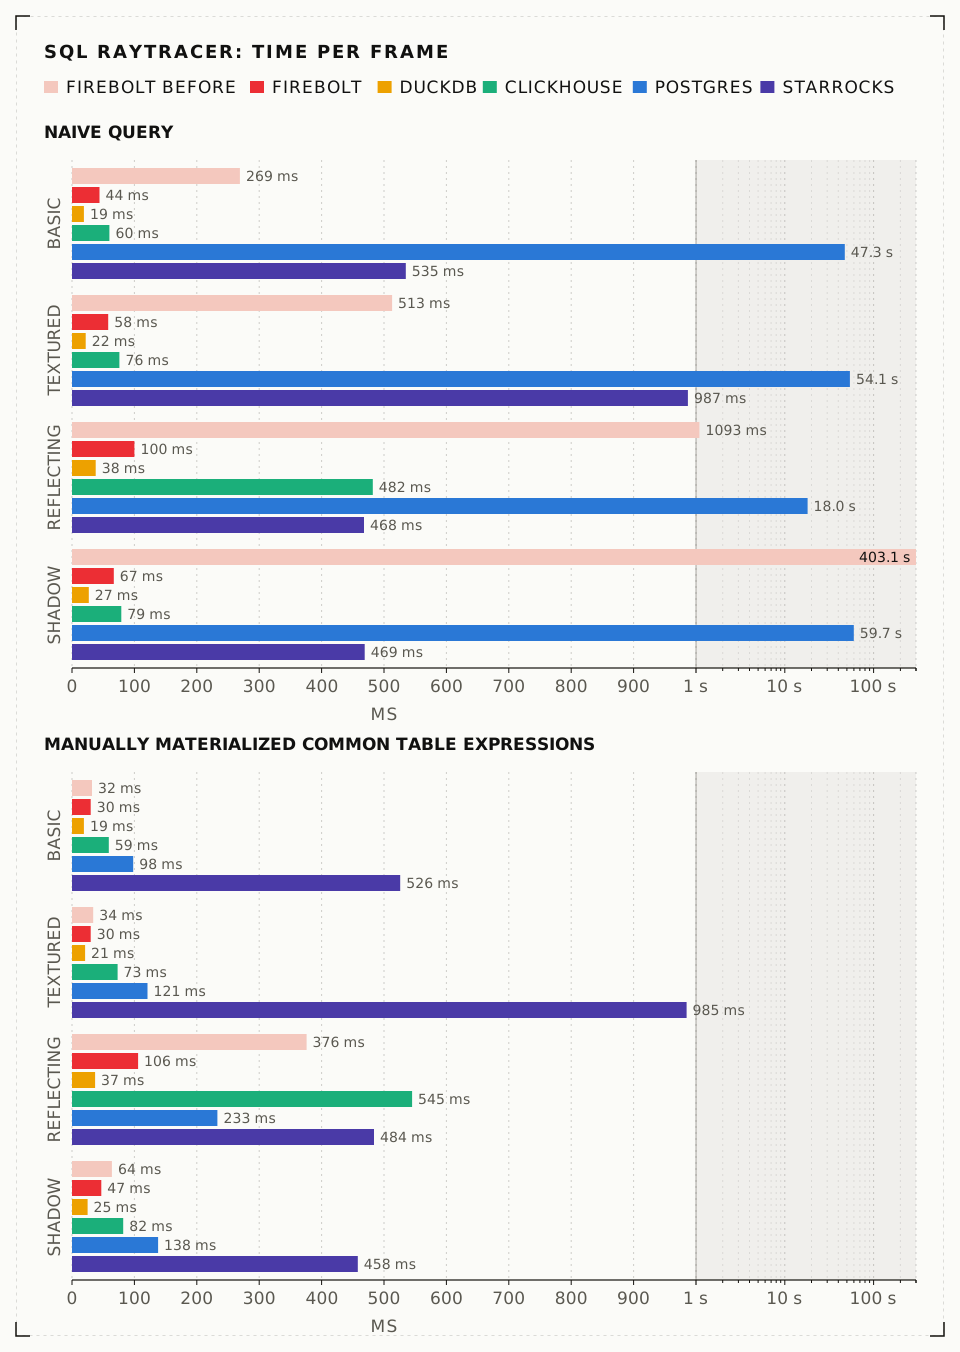
With the improvements described in this blog post, Firebolt no longer needs materialization as much, and even the materialized queries got up to 3.5x faster. The largest improvement is visible in the shadow query, whose time drops from 403 s to 67 ms, a factor of about 6000. Firebolt is now faster than ClickHouse, StarRocks and Postgres on every query, and only DuckDB is faster. Most of the remaining gap is planning time for these huge expressions, so there is still room to improve. Note that we include Postgres only as an example, knowing that it is single threaded for those queries. For Firebolt, the actual execution does not do a lot of number crunching, so those queries are mainly tests for expression handling in the planner.
The problem of inlining the huge expressions shows up in the query plans. As an extreme, the non-materialized Postgres query plan exceeds 1 GB for the reflecting cube. The Firebolt physical plans had the same problem. Firebolt now avoids this blow-up because the runtime understands let.
Of course, these queries have a very specific form. It is still nice that we managed to improve our planner so much with rather simple and elegant changes. Those optimizations make Firebolt more resilient for future customer queries, including the large queries that agents tend to generate. If you want to play around with the queries yourself, you can view them here.
## Conclusion
We experimented with four simple raytracing queries written in SQL on Firebolt. Those queries consist of complex and deeply nested expressions that our planner originally struggled with. Through extensive profiling, we managed to improve the performance of Firebolt significantly. On the side, we found one change that alone improved a customer's queries by 10-15%. All the improvements described here are implemented in Firebolt now. Some are already live, and the others will be rolled out in a future update.